Upper-Funnel Incrementality Case Study: 67% Revenue Lift
Upper-Funnel Incrementality Case Study: 67% Revenue Lift
Upper-funnel incrementality case study: a national brand’s themed product launch
A national consumer brand spent six figures on Demand Gen and YouTube ads tied to a themed product launch. Their marketing team needed to know whether the spend actually moved the business. Impression counts weren’t proof.
Upper-funnel reporting in Google Ads and GA4 is famously weak. Impressions are easy to count, last-click revenue is easy to report, and the space in between (the actual incrementality question) is where most agencies hand-wave.
We built the measurement.
The setup
The campaign ran for 6 weeks across Demand Gen and YouTube, targeting audiences interested in the product category. A featured product line was the primary promotional focus. Sitewide traffic, product-level revenue, and user-level exposure data all flowed into BigQuery via the GA4 export and the Google Ads Data Transfer.
The three questions
We built the analysis to answer three questions the client actually cared about:
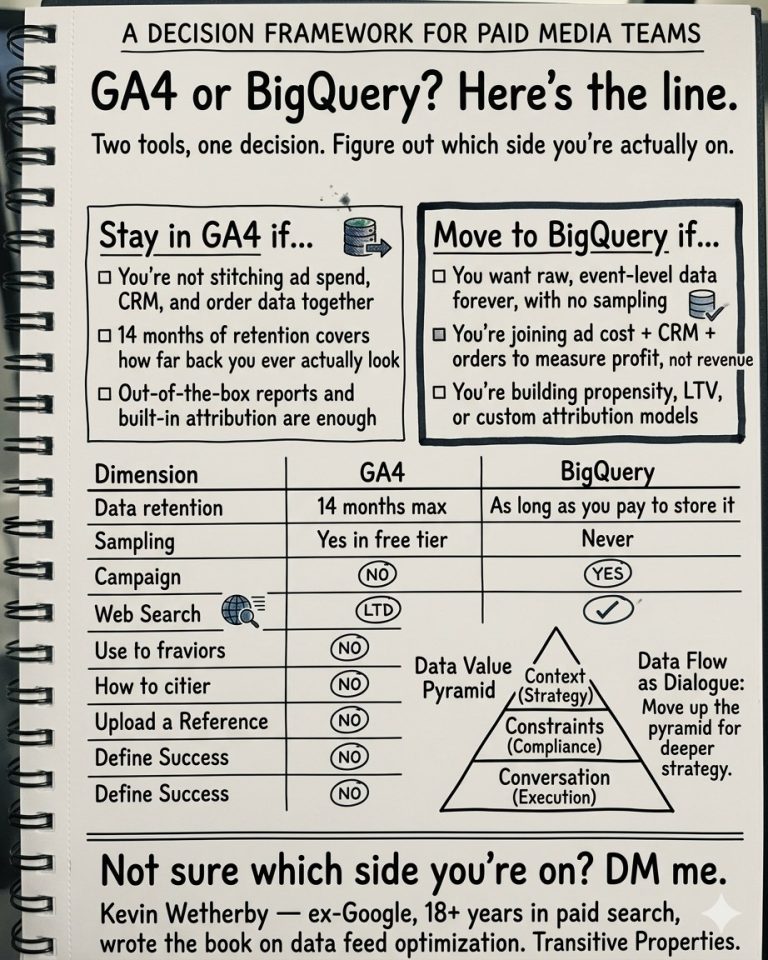
- Did the campaign lift sitewide traffic, or just consume budget?
- Did the featured product line see real revenue growth, or did sales just shift from other products?
- Did exposed users convert at higher rates than unexposed users?
None of these are answerable in the GA4 UI alone. All three are answerable in BigQuery with the right joins and a clean pre/post framing.
What the data showed
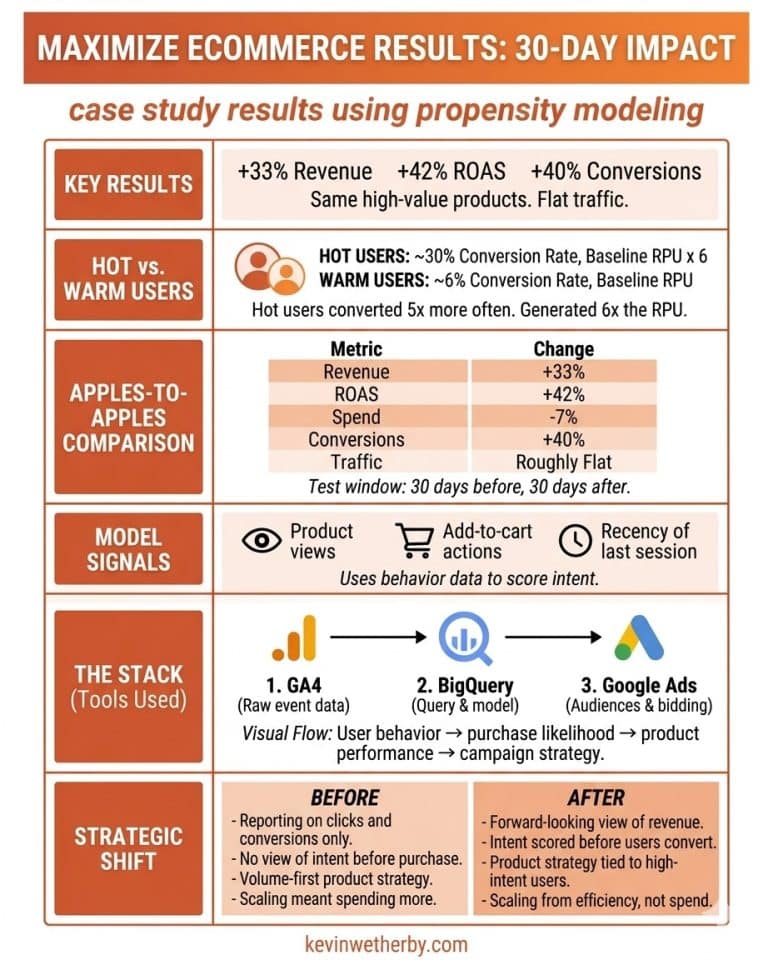
Sitewide traffic: ~10% lift. Sessions and users across the entire site grew about 10% in the post-launch window versus the pre-launch baseline. The lift held across channels, suggesting the ads drove real search and direct demand in addition to impression-served users.
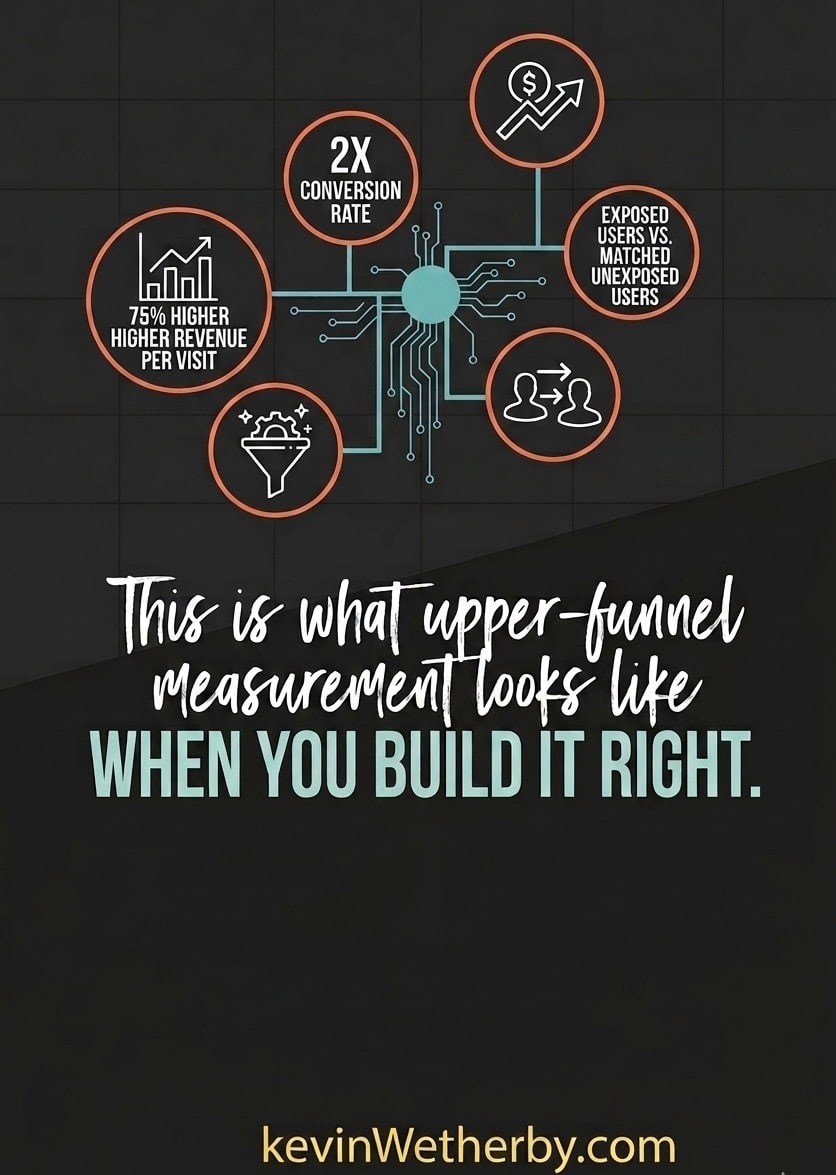
Featured product line: +67% revenue. Revenue for the featured product line grew 67% post-launch. Revenue for the rest of the site stayed flat to slightly down. That gap is the incrementality signal. If the campaign were just shifting existing customer demand between products, the rest of the site would have dropped by roughly the amount the featured line grew. It didn’t. The featured line grew on net-new demand.
Exposed vs. unexposed users: 2x conversion rate, 75% higher revenue per visitor. Users who saw the campaign converted at twice the rate of matched unexposed users and spent about 75% more per visit. The campaign was finding buyers.
How we measured it
The methodology that made this analysis possible:
- User-level journey tracking across sessions. GA4 exports to BigQuery with session-level granularity, so we could follow users from first campaign exposure through to eventual conversion (or non-conversion) across multiple visits.
- Pre/post sitewide comparison against baseline. Six weeks of pre-launch data as the baseline, six weeks of post-launch as the treatment window. Seasonality controls applied where the calendar required them.
- Exposure cohorts from the Google Ads Data Transfer. Users who saw the Demand Gen or YouTube ads were identified via user IDs and compared against a matched unexposed cohort.
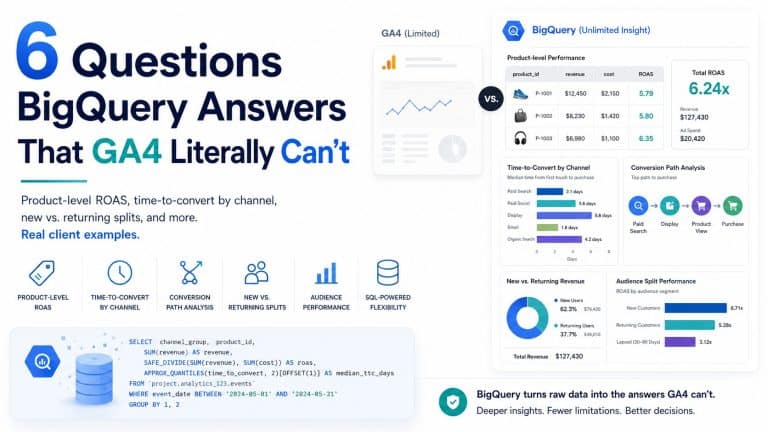
- Product-level revenue joins. Item revenue from the GA4 ecommerce export joined to ad cost by campaign, so revenue could be attributed at the SKU level rather than rolled up at the campaign level.
None of this is possible in Google Ads reports or the GA4 UI. It required BigQuery and someone willing to write the SQL.
Why it mattered for the client
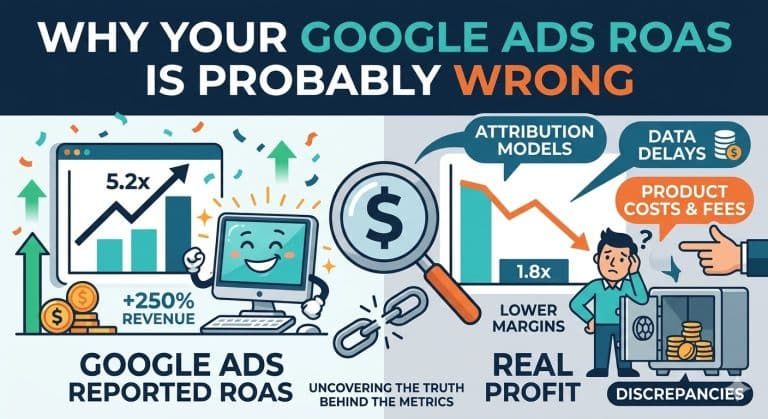
The client had been under internal pressure to cut upper-funnel spend. Reported ROAS on Demand Gen and YouTube looked weak because last-click attribution handed credit to paid search and email. Without the BigQuery analysis, the logical move was to redirect the budget downstream.
The analysis reversed the decision. Upper-funnel spend was renewed at a higher budget for the following quarter. The client also baked this measurement framework into their standard reporting, so every subsequent campaign launch gets the same pre/post incrementality read.
If you need this for your business
A lot of advertisers are either overspending on upper-funnel campaigns they can’t measure or cutting them because the reported numbers lie. Both are expensive mistakes.
If you’re running Demand Gen, YouTube, or any upper-funnel channel and your internal case for keeping them alive is getting shaky, this is the analysis that settles the argument with data. I build it end-to-end for clients spending $30K+/month on ads: GA4 BigQuery setup, custom incrementality measurement, and reporting that answers the upper-funnel question honestly.