GA4 + BigQuery Behavioral Modeling: How We Grew Revenue 33% on Flat Traffic
An ecommerce client came to us with the problem I hear frequently from brands in the $30–50k/month ad spend range: the account was working, but nobody could explain why it was working, and nobody had a defensible plan to make it work harder.
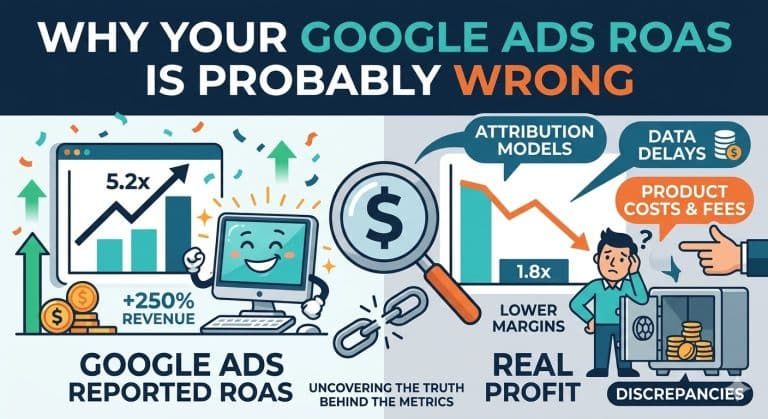
Clicks and conversions were the whole picture. That was the problem.
This is a writeup of what we built, the decisions we made, and the 30-day test we ran to prove it moved the numbers.
Quick context on me. I’m ex-Google. I’ve been in this industry 18 years. I wrote the book on data feed optimization. Propensity modeling on top of GA4 exports in BigQuery is most of what I do now, so everything below reflects a fairly opinionated way of running an ecommerce account.
Table of Contents
Where things stood
The client had a strong baseline. Campaigns were producing results. ROAS was healthy enough that nobody was panicking.
Scaling was the problem. Two options were on the table: spend more, or target smarter. The client didn’t want to spend more without a good reason, and the platform reports couldn’t give them one.
The gaps were predictable:
- Reporting relied on standard signals (clicks, conversions, after-the-fact ROAS).
- There was no view of intent. A user with three add-to-carts looked about the same as a casual browser in the account.
- Product strategy was volume-first. The SKUs driving the most sessions got the most attention, regardless of whether those sessions paid back.
None of this is unusual. Most accounts at this spend level hit the same wall.
The setup
The system we built connects four things:
user behavior → purchase likelihood → product performance → campaign strategy
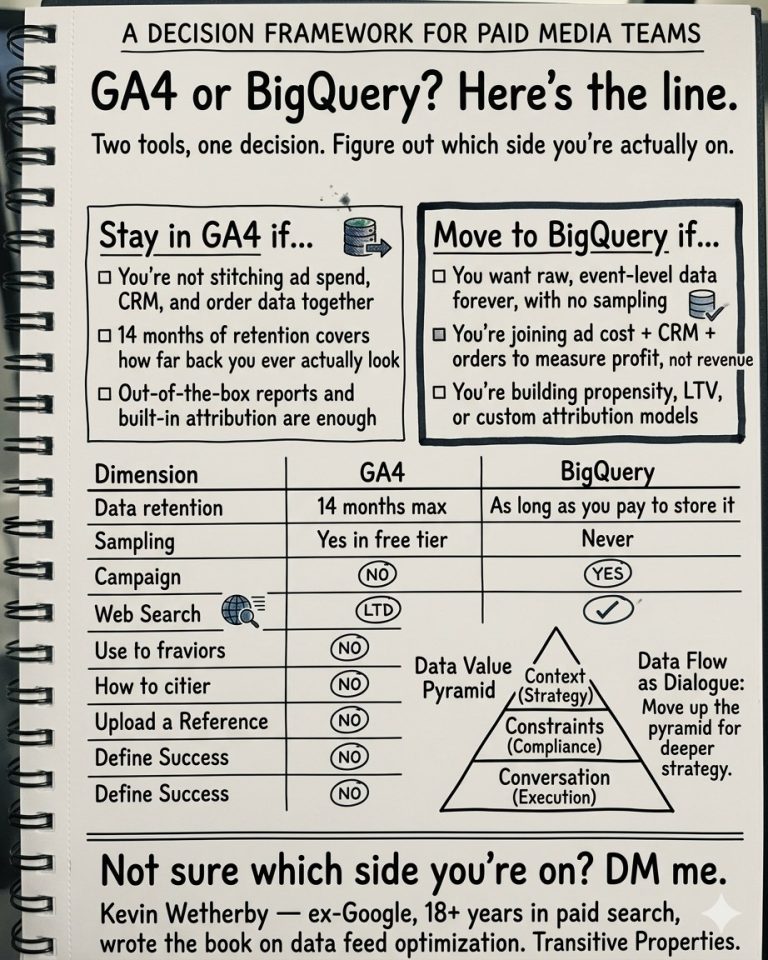
Each piece is simple on its own. The value sits in the connections. GA4 gives you raw event data. BigQuery lets you actually query it. Google Ads lets you push audiences and priorities back in. So you get a loop that gets smarter the longer it runs.
Step 1: Behavioral modeling
We pulled the GA4 exports into BigQuery and looked for signals that correlated with purchase. Nothing exotic:
- Product views
- Add-to-cart actions
- Recency of last session
We scored users on those signals and turned the score into a purchase-likelihood estimate.
If you’ve never run this kind of model, the first pass is usually underwhelming. Everyone comes out looking vaguely warm. That’s normal. The shape of the model matters more than the first version of the output.
Step 2: Segmentation (and fixing the segmentation)
First pass, we used threshold-based “high-intent” buckets. The segments were too generous and didn’t predict much. The segmentation was doing more harm than good.
So we went back to the data, looked at the actual distributions of behavior, and re-cut the segments against what users were really doing. That is the step most teams skip. You cannot set a gut-feel threshold once and walk away.
After the rework:
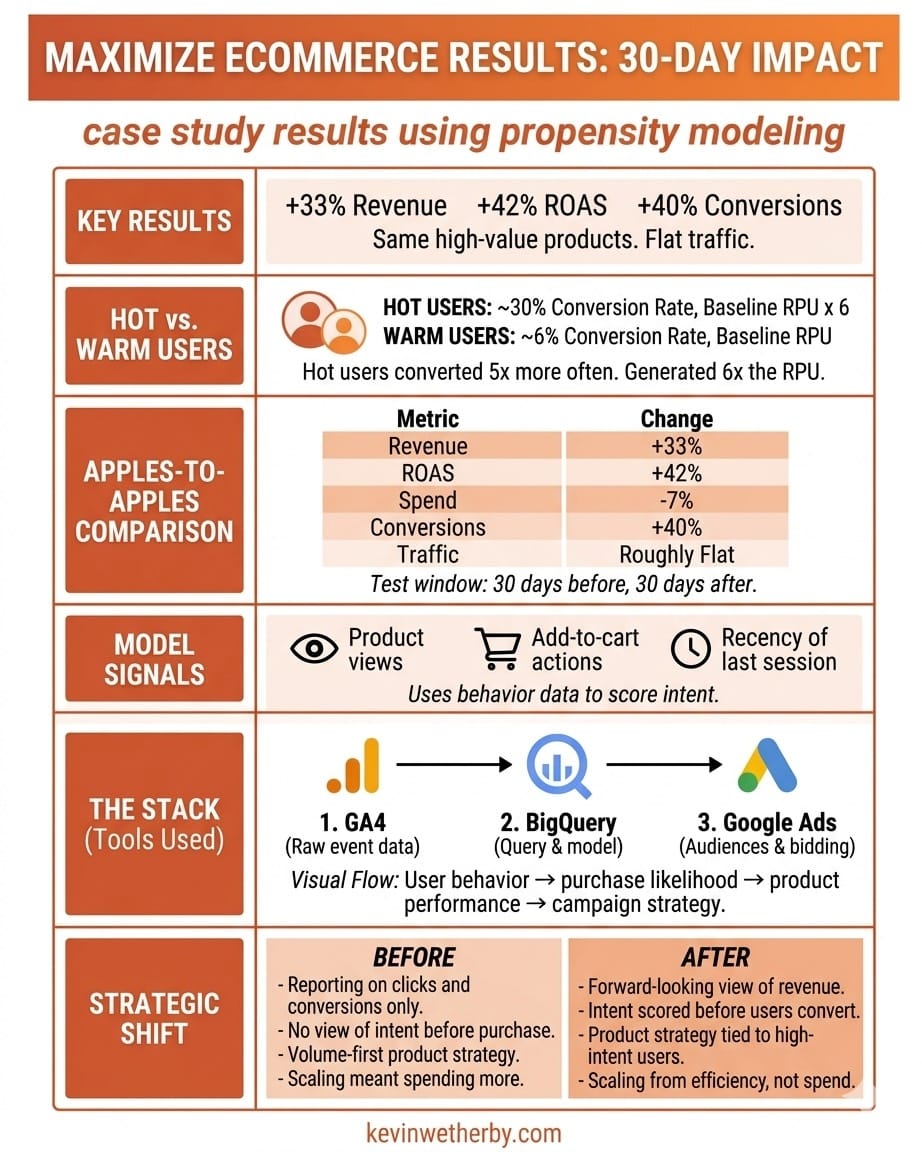
- Hot users: multiple add-to-cart actions, deep product engagement. Converted at ~30%.
- Warm users: early-stage interest. Converted at ~6%.
Hot users generated about 6x the revenue per user of warm users. That’s the kind of gap that changes how you bid.
Step 3: Product prioritization
With the user side cleaned up, we moved to products. Three filters:
- Which SKUs drove revenue efficiently?
- Which ones attracted engagement from the high-intent users we now knew how to identify?
- Which ones sat in the overlap?
The overlap was the shortlist. We rebuilt campaign structure and bidding around those products. Not as a full account overhaul, just a priority shift.
The test
Same products. Same account. 30 days before the changes, 30 days after. Apples to apples.
| Metric | Change |
|---|---|
| Revenue | +33% |
| ROAS | +42% |
| Spend | -7% |
| Conversions | +40% |
| Traffic | Roughly flat |
The flat traffic line is the one worth staring at. We didn’t buy more clicks. We sent the budget to the users and products where it actually paid back.
What this validated
- Behavioral signals in GA4 can predict purchase intent accurately enough to act on.
- High-value users are identifiable before they convert, which means you can bid for them while they’re still considering.
- When product priorities and user intent agree, the efficiency gains are big.
When this probably is not for you
A few honest caveats, because not every account is a fit:
- If you’re spending under $10k/month, the setup usually won’t pay for itself inside a reasonable timeframe.
- If your conversion volume is low, the model won’t have enough data to learn from. Garbage in, garbage out.
- If your catalog is very small, product-level prioritization has less room to move anything.
If any of that sounds like you, the first move is cleaner conversion tracking and a tighter campaign structure. Propensity modeling is a second-stage problem, not a first-stage one.
The shift
The real change was mental:
buying traffic → targeting high-value users
scaling spend → scaling efficiency
Once the system is in place, it compounds. The model gets better as it sees more data. Budget follows the users and products that pay back. And product merchandising and ad strategy start actually talking to each other, usually for the first time.
What this gives you
- Budget that follows intent, down to user segment and SKU
- Paid media that scales faster than spend
- A forward-looking view of revenue
- A repeatable system you keep improving