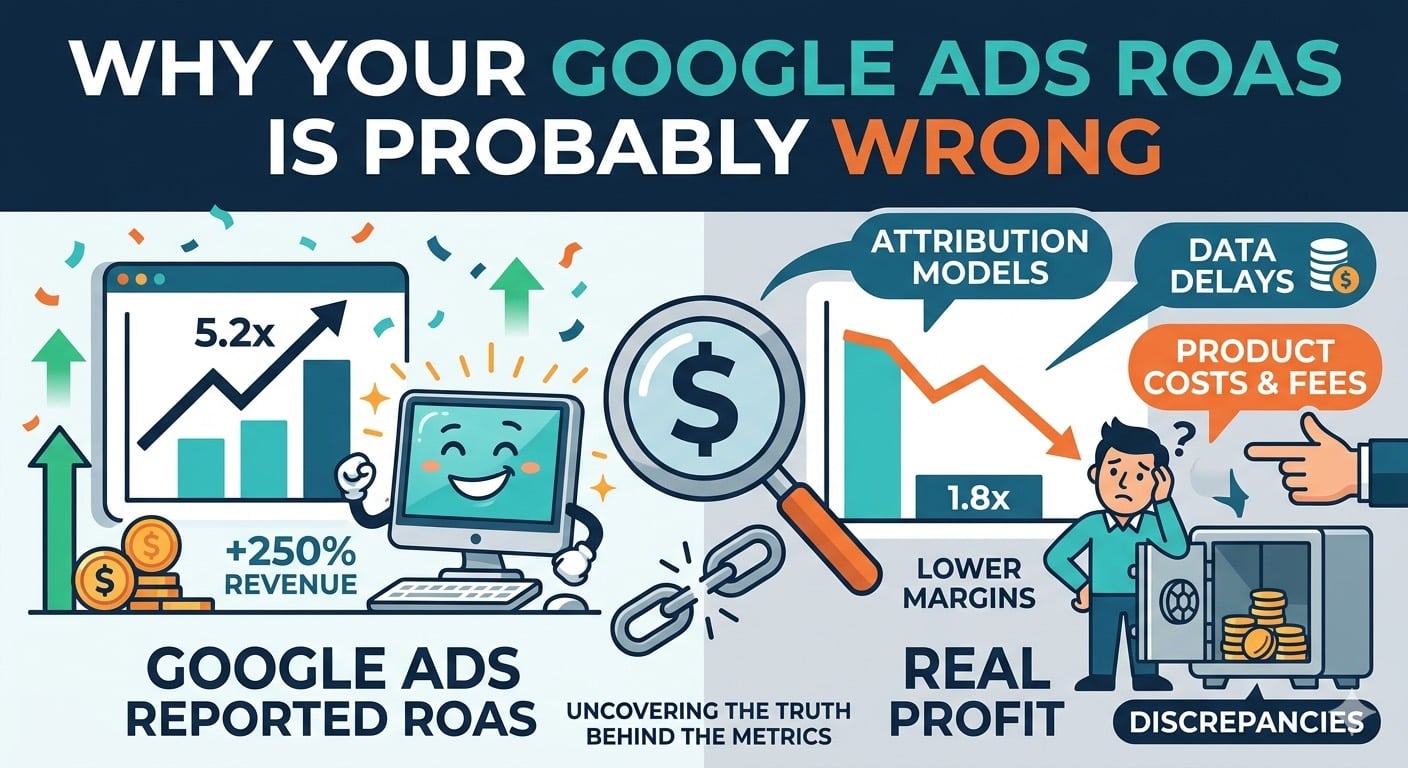
If you’re making Google Ads decisions based on the ROAS number in the platform, you’re almost certainly optimizing toward the wrong thing.
I’m not being dramatic. In every audit I run for a new client, the first exercise is reconciling Google Ads ROAS against what actually hit the bank account. The two numbers rarely match, and the direction of the error is usually the same: Google’s ROAS is higher than real profit would suggest.
I’ve spent 18 years in paid search, including a stretch at Google. These are the three reasons the reported number is almost always wrong, and what to do about it.
Reason 1: last-click attribution is the default
By default, Google Ads credits the last paid click before a conversion. That number shows up in your ROAS column.
It ignores:
- Upper-funnel campaigns that seeded the purchase and got undervalued
- Organic and direct visits that did the actual convincing
- Returning customers who were already coming back and got re-attributed to a Google Ads click they happened to touch
Run the same campaigns through GA4’s data-driven attribution and the ranking of your top performers usually shifts. Run it through BigQuery with proper multi-touch analysis and it shifts more.
Reason 2: platform-reported conversions include double-counting
Google Ads counts conversions from Google’s tracking. GA4 counts conversions from GA4’s tracking. If you’ve imported both into Google Ads (a surprisingly common audit finding), the platform can count the same sale twice under different conversion actions.
I’ve seen accounts where fixing conversion de-duplication alone dropped reported ROAS by 30-40%. Nothing about the business changed. The number was just wrong before.
Reason 3: revenue at the campaign level hides product-level disasters
A campaign can show a 5x ROAS and still be unprofitable.
Example from a recent audit: a Shopping campaign reporting strong ROAS was driven almost entirely by one SKU with a 60% gross margin. The other 40 products in the campaign were selling at break-even or worse. Pausing the losing products lifted real profit by about 22% while barely moving reported ROAS.
The Google Ads UI can’t show you this. Campaign-level metrics average everything together.
What accurate looks like
To get a ROAS number you can actually trust for decisions, you need:
- Conversion tracking verified on the server side, not just the pixel
- Revenue joined to product-level data (not just campaign-level)
- An attribution model that matches how your customers actually buy (conversion lag, multi-touch)
- Cost data reconciled against what Google Ads actually billed you
That’s a BigQuery-shaped problem. The Google Ads UI can’t get you there.
When ROAS in the UI is good enough
Honestly: if you’re running a small account (under $10K/month), selling a single product at a consistent margin, and your sales cycle is one session, the in-platform ROAS is probably close enough. Optimize against it, check your bank account monthly, and don’t overbuild.
The gap between reported and real ROAS widens as accounts get bigger, product mixes get more varied, and sales cycles get longer. That’s when you need to build it yourself.
ROAS isn’t the goal anyway
ROAS is a proxy for profit. Past a certain spend level, the proxy stops tracking well. I’ve had clients cut spend on “high-ROAS” campaigns and see profit go up, because the campaigns weren’t actually driving incremental revenue.
The number you care about is incremental profit after ad spend, rolled up by product or customer segment. The Google Ads ROAS column is a starting point for that conversation, not the answer.
If this sounds like your account
If you’re spending $30K+/month on Google Ads and your gut tells you the reported ROAS doesn’t match what’s hitting the P&L, that’s what I investigate end-to-end: tracking audit, BigQuery-based reconciliation, and a reporting setup that surfaces real profitability at the product and campaign level.