How to audit your Google Shopping feed (the way I actually do it)
Most feed audits are useless.
A consultant pulls a CSV, runs it through a free online tool, and hands you a 40-page PDF flagging that 200 products are missing a color attribute. Nobody fixes anything because nobody knows which 200 products are dragging down ROAS and which 200 don’t matter.
I’ve been doing this for 19 years, including time at Google. I wrote a book on data feed optimization. I run feed audits on accounts spending anywhere from $5K to $500K a month on Shopping and Performance Max. The shape of the audit is the same regardless of size.
Here’s how I actually do it.
What an audit is for
A real audit answers three questions:
- Where is the feed costing you money right now?
- Which fixes will move performance fastest?
- What’s the order of operations?
That’s it. Everything else is filler.
A feed has hundreds of attributes you could improve. If you try to fix all of them at once, you’ll fix none of them well. The audit’s job is to give you a ranked list, not a comprehensive list.
Step 1: Pull the feed and join it to performance
A feed audit without performance data is useless. Half the attributes you’d fix on a product that did $40 last quarter aren’t worth fixing.
I pull the feed from Merchant Center (Products → All products → Export). Then I pull the last 90 days of Shopping performance from Google Ads at the item ID level. If the account has BigQuery for Google Ads exports running, I use that instead, because it gives me query-level data and search term context.
Then I join the two on item ID.
Now I have a single table. Every row is a product. Every product has its feed attributes plus impressions, clicks, cost, conversions, and revenue. This is the only file I work from.
If you don’t have BigQuery on the account yet, the Google Ads UI exports work. Slower, but workable.
Step 2: Segment and find the 80/20
I segment the joined dataset three ways:
- By revenue. Find the top 20% of SKUs that drive 80% of revenue. These are the hero products. Every audit focuses here first.
- By product type and brand. Look for categories where impression share is low but conversion rate is healthy. Those are the scale opportunities.
- By cost with zero conversions over 90 days. These are the bleeders. Sometimes the fix is a custom label that excludes them from bidding.
This step usually takes an hour. The output is three lists: heroes, scale opportunities, and bleeders.
Step 3: Audit the hero titles by hand
Software can flag missing fields. Software cannot tell you whether your title for the “Stanley Quencher 40oz Tumbler” should lead with the brand, the size, or the color.
So I audit the top 50 revenue-driving titles by hand. For each one I ask:
- Does the title lead with what people search for?
- Does it include size, color, or other distinguishing attributes where relevant?
- Is it under 150 characters so the important stuff isn’t truncated?
- Does it duplicate words Google already pulls from other fields?
I keep notes in the same spreadsheet. By the end I have a rewrite list for the products that drive most of the revenue. There’s a deeper piece on titles in this cluster if you want the full title playbook.
Step 4: Read every Merchant Center diagnostic
Open Merchant Center. Go to Products → Diagnostics. Read every account-level issue. Then read the top 20 item-level issues by affected SKU count.
I’m looking for:
- Disapprovals that take inventory out of the auction
- Account-level warnings (these can suppress the entire account in subtle ways)
- Missing required attributes by category (apparel categories have the most)
- Image policy violations
- Price mismatch warnings between feed and landing page
- Shipping or tax setup issues
Most accounts I open have between 5 and 15 fixable issues at the account level. Some of these are easy 30-minute wins that put inventory back into the auction immediately.
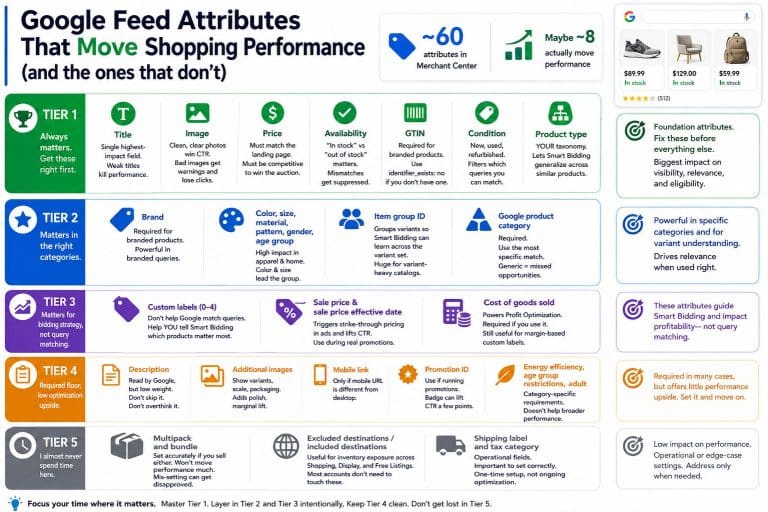
Step 5: Inspect attribute coverage on the products that matter
For the hero SKUs and scale-opportunity SKUs, I check coverage on the attributes that actually move performance. I’ll cover which ones those are in the attributes article, but the short list:
- GTIN (present and correct)
- Brand
- Product type (your taxonomy, not Google’s)
- Color, size, material, pattern, gender, age group where applicable
- Item group ID for variants
- Sale price and sale price effective date where used
- Custom labels
Coverage rates by attribute go straight onto the fix list with priority based on revenue at risk.
Step 6: Audit the custom label scheme
Most accounts have either no custom labels or custom labels that nobody uses for bidding. Both are wasted opportunity.
A useful custom label scheme answers questions like:
- What’s my margin tier on this product?
- Is this product price-competitive against the rest of the auction?
- Is this seasonal? Evergreen?
- Is this a clearance SKU or a full-margin SKU?
- Is inventory deep enough to scale spend?
If the labels exist but the campaign structure doesn’t use them, that’s a separate problem and goes on a different list (campaign fixes, not feed fixes).
Step 7: Check price competitiveness
Merchant Center has a Price Competitiveness report and a Price Insights report. I pull both. Then I segment by product type to find categories where I’m priced 20%+ above the auction median. Those products are getting throttled by the system regardless of what I bid.
Sometimes the fix is a custom label that flags uncompetitive prices and excludes them from your most aggressive bidding strategies. Sometimes it’s a merchandising conversation with the client about pricing. Either way, you can’t fix it if you don’t measure it.
Step 8: Write the prioritized fix list
The deliverable is one document. Usually 8 to 15 pages. It has:
- Top 10 fixes ranked by estimated revenue impact
- For each fix: what to change, where, who owns it, and a rough effort estimate
- The hero title rewrite list as an appendix
- The Merchant Center diagnostics fix list as an appendix
- The custom label scheme proposal
That’s the whole audit. No charts that exist just to fill space. No 40 slides explaining what Shopping is.
How long this takes
A full feed audit on a $5K-50K/month account takes me 2 to 3 days. Bigger accounts (1000+ SKUs, multiple feeds, international) can take a week.
Most of the time is in step 3 (hand auditing titles) and step 8 (writing up the prioritized list). The data work is fast.
When to skip the audit
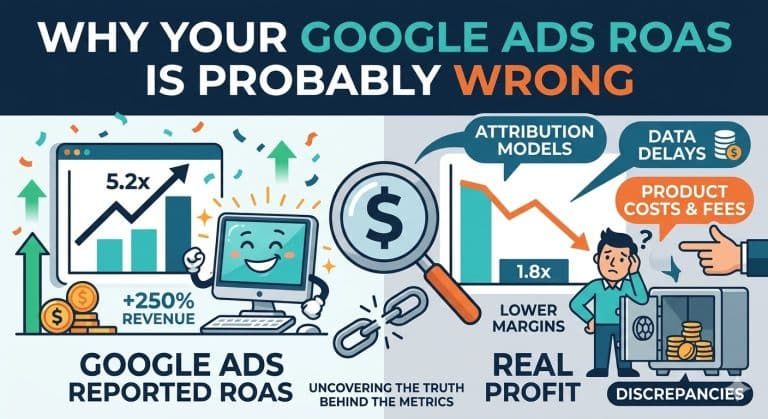
If your conversion tracking is broken, fix that first. Auditing a feed against bad performance data gives you bad fixes.
If you have under 50 SKUs, you don’t need a full audit. Spend a day rewriting your titles and reading the Merchant Center diagnostics tab.
If you’ve never set up Merchant Center properly (no shipping, no tax, missing returns policy), do the setup work first. An audit on a fundamentally broken account just lists the same fixes you’d find in 20 minutes.
What I leave you with
If you do this yourself, the order matters. Hero titles first. Merchant Center hygiene second. Attribute coverage third. Custom labels and price competitiveness fourth. Reporting and dashboarding fifth.
If you want me to run the audit on your account, I take a small number per quarter. Get in touch.
For the broader feed optimization context, the data feed optimization guide covers where this fits in the bigger picture. For the data stack that makes audits like this possible, start with GA4 and BigQuery for Google Ads.